How to calculate the Gender Wage Gap of Immigrants in the USA?
The utopian dream would be that regardless of gender and nationality, all people would earn equally taking into account their education and their professions. Economically speaking, people with the same productivity should obtain the same wage, in spite of differences in no-productive attributes. However, the world is not always as we would like it to be, and in fact, we can observe that certain groups earn less than the others, even after taking into account differences in characteristics. What is less evident, however, is why these groups receive lower wages. Not surprisingly, a simple statistical analysis shows that the gender wage gap experienced by migrants in the same destination country is not constant.
The calculation of the gender wage gap for immigrants’ is not trivial. An important part of well-known institutions and journalists considers just the difference in average wages as a measure of the gap, to which we refer to as “raw’’ gender wage gap. This measure is somehow troublesome as it does not take into account that men and women differ in their characteristics: it is well-known that women, particularly the young women, are more likely to hold a tertiary degree than their male colleagues. Now, if women are substantially better educated than men, and still receive the same nominal wage, then the “raw’’ gap would be zero, but that does not mean that there are no gender differences. To overcome this problem, we obtain measures of the gender wage gap adjusted for differences in individual characteristics.
There are many methods to “adjust’’ the GWG, each with its benefits and downsides. In this case, we use the so-called Ñopo decomposition, developed by (no surprises here) Ñopo (2008). This method has two advantages over others. First, it restricts the calculation of the gender wage gap to men and women with identical characteristics (i.e. it is based on perfect matching). This helps us to avoid comparing older men with high school education only to young women with PhD. Since not everyone has its counterpart, Nopo produces two additional terms that most other decompositions ignore; these terms measure differences between men (and women) inside and outside of the common support. The second advantage, from a more technical perspective, is that it does not require to estimate the relation between wages and personal characteristics. This feature gives Ñopo decomposition and additional flexibility that other methods lack.
In order to conduct this analysis, we require a database from which we can obtain information on migrants and their wages. This is not so common, as migrants often represent a small fraction of the population and to make things more difficult, they are often hard to track. If, additionally, we would like to distinguish between immigrants country of origin, then it becomes even more challenging. To overcome this difficulty, we rely on data from the American Community Survey (ACS) that is the largest micro data set available, it covers 1% of whole US population. Figure 1 presents the measures of the immigrants’ adjusted gender wage gap obtained for different countries of origin.
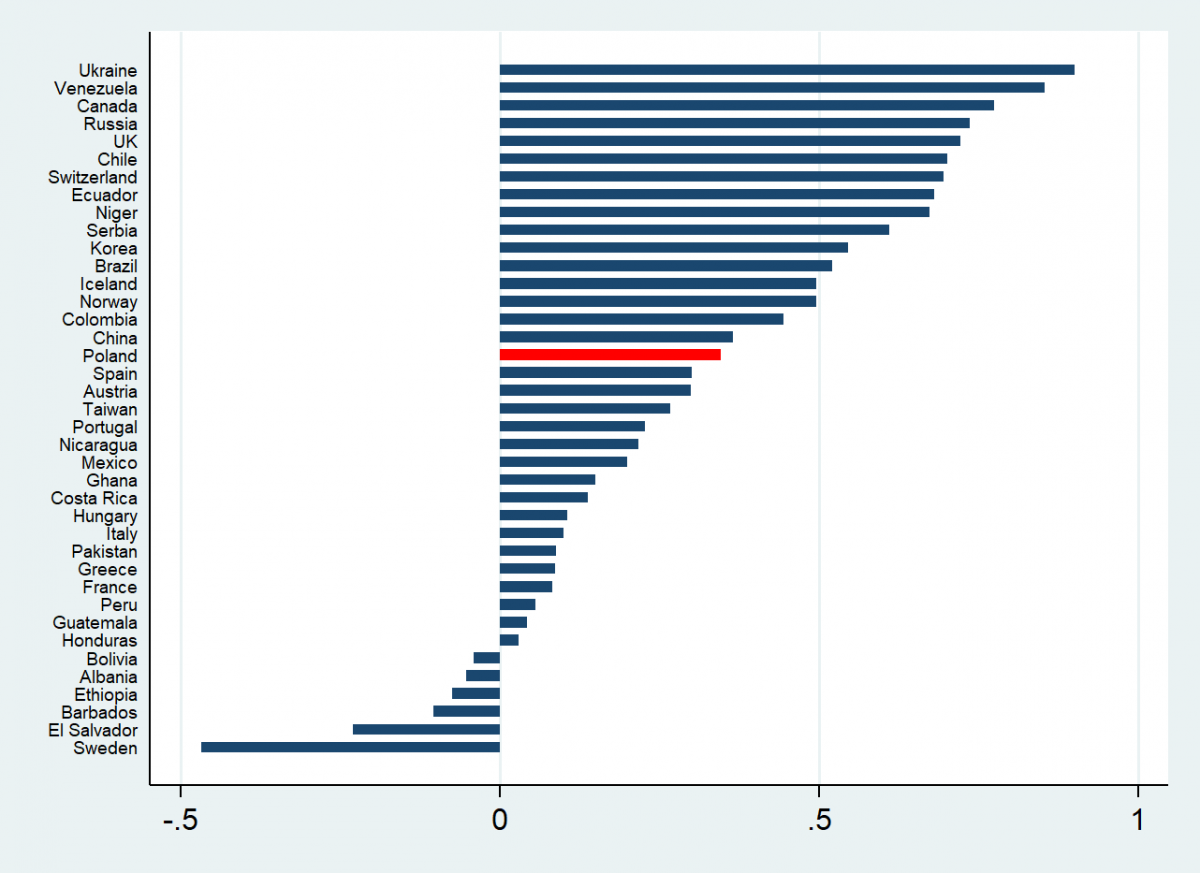
Notes: Measures of the adjusted gender wage gap obtained for migrants in the US using Ñopo (2008) decomposition. The decomposition controls for education, age, marital status and their interactions. Each horizontal bar represents a different country of origin, Poland is marked in red.
Source: American Community Survey
Looking at our data, we can see that the range of the adjusted GWG experienced by immigrants ranges from -47%(Sweden) to GWG 89% in the case of Ukrainian nationals living in the US. Looking at Figure 1, we might wonder why some developed countries such as Switzerland experienced higher unexplained GWG than developing countries such as Pakistan. This might be due to the fact that people coming from Pakistan might be more likely to work in low skill sectors where gender wage gap is not so severe. On the contrary, immigrants from Switzerland, who might be on average better educated and interested in high skill position might have higher wage disparity.
This differences in GWG might be also a result of occupational segregation between immigrants from the different source country. The labor market segregation is a distribution of workers across occupations taking into account their characteristics for example country of origin or gender. Another cause of GWG diversity might the fact that women are often tied movers which means they migrate due to career opportunities of their partners. This force them to accept jobs that are available in country of destination or even to drop the labor market for good.
Looking closer to the gender wage gap between Polish workers, marked in red we can easily notice that is lies in the middle of the distribution. The exact value equals to 35% which means that Polish men earn around by one third more than polish women after controlling for the characteristics. This is significantly lower than for example for Ukrainian immigrants that are often perceived as similar to Polish workers.
To conclude, we see that the gender wage gap differs extremely among given countries and even countries that should have similar patterns of the gender wage gap such as Poland and Ukraine or Sweden and Norway are actually different.
Source: Ewa Weychert